A Real-Time Debug Software Tool for Silicon Validation, Design Validation and System Engineers
proteanTecs SystemLens™ is a real-time debug software tool for silicon validation, design validation and system engineers. It gives parametric visibility inside the chip, even while a real workload runs on the system under test. The application reads measurements from in the proteanTecs Hardware Monitoring System embedded in the silicon and visualizes them with sub-second latency.
When engineers bring up a system, the chip's internal behavior is largely hidden, and they often have to infer it from functional outputs, UART logs, and external measurements. SystemLens reveals the physical layer underneath, so timing margin, IR drops, workload stress, local temperatures, voltages, and noise become visible while the system operates.
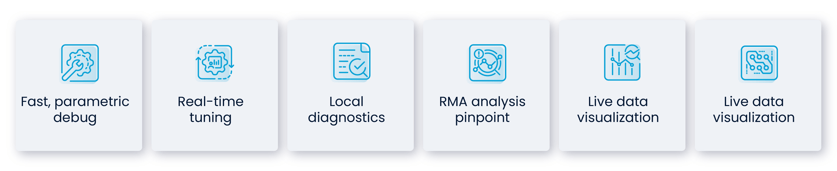
SystemLens reads proteanTecs on-chip monitors to give system engineers real-time visibility inside the chip.
Why Passing Functional Tests Does Not Prove System Robustness
During New Product (NPI), engineers exercise the chip across voltages, temperatures, and target workloads, watching system outputs for any sign of failure.
A functional view can confirm whether the output looks correct but cannot show how much timing margin the silicon has left. When something goes wrong, the physical behavior driving it stays hidden while the chip runs.
Passing every functional test does not mean the device has enough margin to survive in the field. At the output, a path that barely closes timing looks identical to one with full margin.
Systems that exhibit borderline timing, voltage, or noise behavior can pass every inspection, then fail in the field under different workloads, operating conditions, and aging.
Transient events add another blind spot to bring-up. An engineer may catch a glitch once on a scope, with no way to rewind and inspect what caused it. Without continuous capture and logging, a rare event can pass unrecorded, and the conditions that produced it can be hard to recreate.
What System Engineers Can Do With SystemLens
The use cases below span first power-on through field-return analysis, and each gives engineers immediate visual confirmation of system stability and integrity.
First Power-On Timing Margin Check
At first power-on, SystemLens reads timing margin directly from the monitors across the die. The check confirms that paths hold expected slack under an active workload before deeper functional bring-up begins.
Workload to Workload Comparison
Users can run different workloads on the same board and compare how timing margin and stress indicators respond in each case. The comparison shows how hard each workload pushes the device, which the functional output alone never reveals.
Clock Delivery Network (CDN) and Power Domain Network (PDN) Debug
Clock delivery and power delivery problems can surface as random functional instability. SystemLens places CDN and PDN noise on the same timeline as timing margin and workload stress. A voltage droop or a clock jitter event then lines up with the loss of margin it causes, at the same instant on the chart. The disturbance can be localized to a specific power domain or clock region instead of being chased as a system-level symptom.
RMA Debug With Pinpointed Root Cause Analysis
When a unit returns from the field, quality and reliability engineers can run a real workload on the returned board and read the monitor data while the suspected failure mode is active. Parametric readings mapped to specific physical locations point the investigation to the affected area rather than working backward from functional symptoms. The system gives engineers visibility into the failing chip in the real environment rather than after system disassembly, enabling much faster time to root cause and accuracy.
How SystemLens Works With Monitor-Based Telemetry in Mission Mode
SystemLens draws its data from the proteanTecs Hardware Monitoring System, which features a network of on-chip monitors that take parametric measurements at test and in mission mode. These combine high coverage and high resolution telemetry across the die. Each monitor produces a time series, and SystemLens streams the readings with sub-second latency.
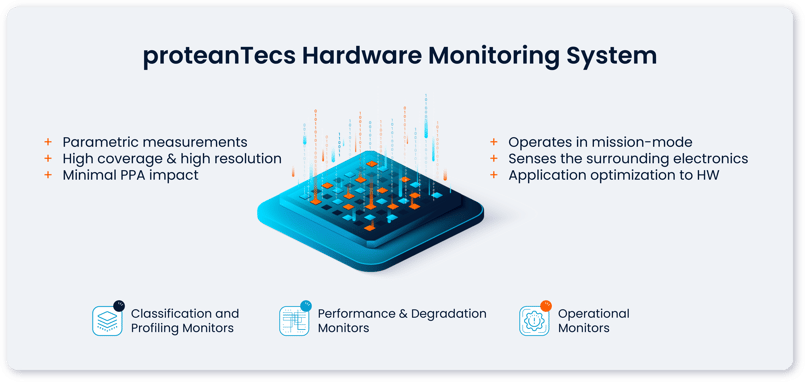
The monitors are built into the chip at design time. SystemLens reads them directly,
so engineers gain parametric visibility without extra probes or board changes.
Timing margin, supply voltage, CDN/PDN noise, and workload stress appear in a single view, alongside temperature and voltage measurements across the chip from proteanTecs LVTS (Local Voltage and Temperature Sensor). Reading the measurements together shows how one rises and falls with another, while the workload is still running. The combined display helps engineers identify root causes faster during debug.
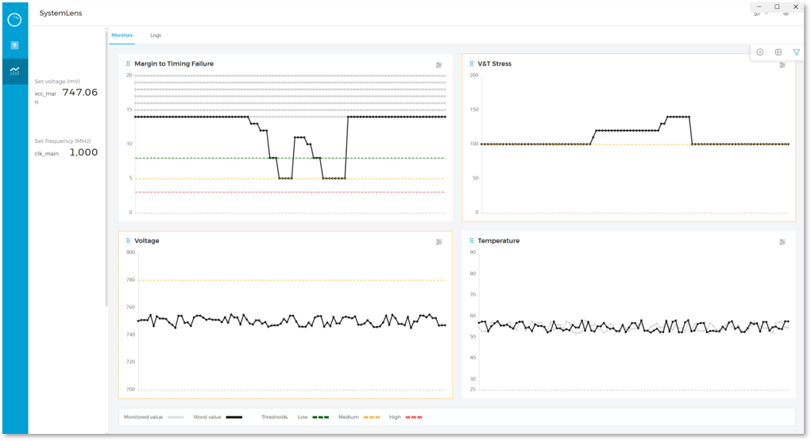
A single SystemLens view showing timing margin, workload stress, system voltages and temperatures.
Monitors also report from known locations on the die, so readings can be rendered as time-series charts that can show all monitors at once or just a single block. Because each reading carries its on-die location, marginal behavior can be pinpointed to a specific block.
SystemLens can also log events automatically whenever a monitored parameter crosses a set threshold. Record and playback let engineers return to a transient long after it passed, and even a single occurrence can be replayed and examined rather than lost.
The software uses existing debug ports, so no probing or hardware rework is required. The application runs on the engineer’s workstation, next to the system under test. The interactive interface works much like familiar scope-based debugging. The difference is the signal source, which now comes from monitors inside the silicon instead of board-level test points.
Where SystemLens Fits Across Bring-Up, Production Testing, and Field Return Investigation
During NPI, SystemLens enables fast parametric debug and real-time tuning. In High-Volume Manufacturing (HVM), it also supports local diagnostics. When a unit comes back from the field, the same tool drives pinpointed RMA analysis on the returned board.
|
Stage |
How SystemLens is used |
|
NPI |
Fast parametric debug and real-time tuning on the system under test |
|
HVM |
Diagnostics of production units that fail unexpectedly |
|
Field returns (RMA) |
Pinpointed root cause analysis on returned boards |
One local installation serves all three stages, from NPI debug and tuning,
to production-test diagnostics, to RMA root cause analysis on field returns.
Timing margin data captured across the use cases above quantifies how close each unit operates to its limits, even when all functional tests pass. The measurement gives engineers a concrete reading of system robustness and reliability rather than a pass-or-fail verdict. Units that pass today but run close to their limits can be flagged for deeper review before they ship.
SystemLens works out of the box with any chip that has proteanTecs monitors inside. A chipmaker with several enabled designs can use one application across all of them.
Coverage extends from EVB (evaluation board) to board to full system, so the tool follows the product from board bring-up through system NPI and production.
The data captured during a debug session stays useful after the session ends. One-click upload to the proteanTecs analytics platform enables anomaly detection and deeper time-series analysis. A thorough offline review can surface insights beyond what a single run reveals.
SystemLens is in use by customers across the datacenter, automotive, communications, and mobile segments.
To see the application running on a live system, schedule a demo here.